
In the previous post, I introduced the rationale for implementing a range of strategies to help students start strong in their University courses. The implications for failure extend further out than we might imagine, and can have severe effects on students and staff alike. In this post I introduce the first of 3 teaching and learning strategies that lecturers can use to assist students in being able to make a more informed decision about their academic aptitude in a course.
1. THE SEQUENCE OF LEARNING AND ITS PURPOSE
Effective and precise design of a learning sequence is imperative if students are to succeed in a course. Clear and manageable learning outcomes must drive the design of learning activities and assessment. Whilst it is not necessary to cater to the whims of students’ interests, it is necessary that a student sees a purpose of taking the course in relation to their personal aspirations. One way to begin the design of the sequence that covers these demands is to develop a visual curriculum map. Such a map shows a student how the topics within the course are intertwined and how the accumulation of the knowledge taught within the course leads to future opportunities.
CREATING A VISUAL COURSE MAP

WHY IS THIS EFFECTIVE PRACTICE?
‘The scientist must organise. One makes a science with facts in the way that one makes a house with stones. But an accumulation of facts is no more a science than a pile of stones is a house.’ Henri Poincare
As the expert, trained for many years in your respective field, you would have built and developed a large web of interconnected ideas (schema) for your subject. It is this schema, or parts of it at least, that you will teach. As the expert, you understand how the parts of the schema fit together, how they feed off each other, and the sequence of learning required to arrive at such a full and complex understanding. But the novice learner arriving into your lecture theatre has little of this knowledge. To them, everything will initially appear very abstract and disparate, particularly pre-census. The abstraction makes it difficult to make connections that will lead to the acquisition of schema, an essential determinant of further learning.
The visual course map serves as a model of your thinking, an explicit representation of the processes required to create relevant schema. As Clark and Mayer (2008) suggest, this immediately offers some context and orientation to your students, and facilitates what Willingham believes to be an essential need in learning in making the abstract more concrete. Such a process is easily recognised considering our own learning – we naturally convert the abstract into meaningful concrete information. Showing students the journey they are about to embark on and providing an otherwise closed window into your mind, and into the course’s structure, helps novices to transform the abstract into the more digestible concrete.
So, SHOW STUDENTS THE SCHEMA!
THE WALK THROUGH
Once made visible, walking students through the schema is the next step. Explaining how each piece of the puzzle fits in with the next is crucial in a sequence of learning. Focusing on the connections and links between disparate ideas is how we move from a pile of stones to the building of a house. Ensuring each connection is secure through formative assessment, particularly through the online supplement, is necessary to avoid the ‘curse of knowledge’ and to know that your students are able to move onto the next component of the course. The curse of knowledge is the idea that when you know something well it is difficult to imagine that others don’t, and so we tend to brush over simple but important links and connections between content. Often, these links are actually vital for a novice to develop their own schema on a topic. This 1976 cartoon by James Stevenson visualises the issue well:

USING TECHNOLOGY TO ENHANCE LEARNING
Shortly, I will be able to provide you with an example of this map being interactive, where students will be able to click on a relevant section and be taken to the relevant learning associated with it. This can be done using H5P and then utilising mastery pathways (more on this soon in the 2nd strategy post).
MODELLING THINKING AND PROCESSES
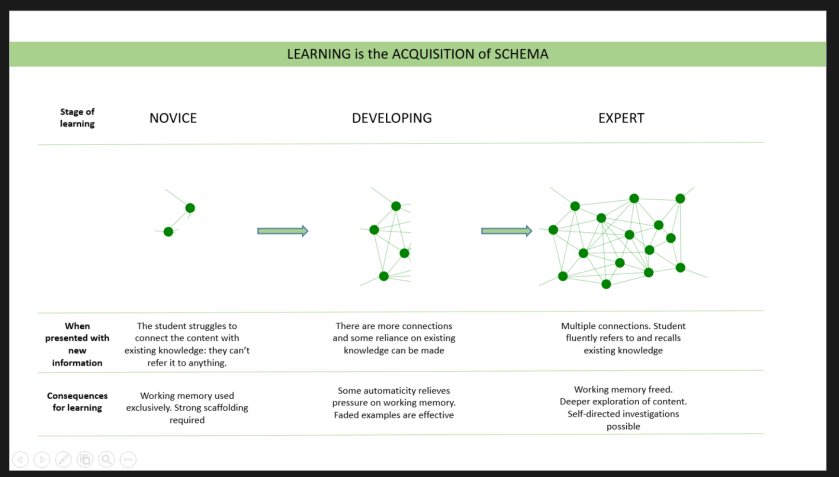
There is an enormous amount of research (Clark and Mayer 2008) validating the effectiveness of modelling your own thinking and processes to students to move them from novices with immature schemata to experts with developed, sophisticated schemata. The novice is indeed a different type of learner to the expert, their less developed schemata severely impacting the cognitive load on working memory, and thus having significant implications to the types of questions and activities you engage them in. The table below illustrates the need to understand the learning continuum when planning a sequence of learning.
Actively explaining the ‘glue’ that binds topics and how you arrived at your understanding provides a model for students to learn and use in subsequent learning, learning in which they are more likely to make their own independent ‘glue’ as they will have more knowledge to draw from and more automaticity in their working memory.
KNOWING WHERE YOU ARE GOING INCREASES ENGAGEMENT
Not only is it useful to highlight to students how each topic fits together to form the schema in a course, but it is also useful to show students how the course fits into a larger picture of learning. A course map should also articulate to students the possible exit pathways that acquiring the knowledge in the present course facilitates. The TEQSA framework for teaching (3.1.1) is clear in this being required:
The design for each course of study is specified and the specification includes: g. exit pathways, articulation arrangements, pathways to further learning.
Research has found that students are often ‘… not aware how different elements of courses functioned as building blocks in the development of their research skills and knowledge.’ An increased awareness of the connections between courses within a program would serve to provide greater opportunity for students to think more about them, and consequently develop the necessary schemata. The visual course map is ideally suited to provide the context and purpose of a course in relation to others in the program. Seeing possible overlaps in outcomes by viewing colleagues’ maps provides opportunity to identify the connections and make them explicit in your teaching sequence. This will deepen learning as the explicit connections will strengthen students’ memory of the content through the continuous retrieval process that such a strategy affords.
This then further encourages students to participate in your course as they will revisit/need the content in other courses too, and the overlap will reduce pre-census cognitive load.
WHAT’S THE EFFECT ON METACOGNITION

STUDENTS: The visual journey map allows students to self-evaluate their own understandings of each section, and source extra information, resources and practice to fill any gaps. This is particularly important in the first 4 weeks of teaching, even though the schema at this point would be only partially complete. I will provide lots more advice on metacognition in the 3rd strategy post.
YOU: The added benefit to this strategy is that it helps you fine tune your course, ensuring that there is a logical sequential flow to the sequence of teaching. It will help you define the key aspects that you want students to focus on, and give you direction on how to structure resources and assessment based around those.
HOW TO CREATE THIS RESOURCE
- Create the map as a rough mind map articulating the key components of your course.
- Work backwards and add in assessment (see part 2) at key junctions
- Then either on your own, or with help from a learning designer, create a series of visuals that sequence the growth of the schema.
HOW TO USE THIS RESOURCE
- The map would be displayed as the first image in your first lecture, as well as the dominant image in the online supplement.
- The first teachings would then highlight the section of the map currently being addressed, with the remaining sections faded out.
- Crucially though, the map should be continually referred to as the learning continues and builds on itself. This not only provides context, but assists the retrieving of knowledge, as students make stronger neural connections to what has already been taught from the map because of it being continually referred to and thus recalled. The students are then beginning to build the schema in their own minds.
- The final lectures would display the map and encourage learners to fill in the links. This could form an excellent formative assessment task prior to exams to help students identify areas of weakness.
The next post will provide strategies for designing the support presented to students in terms of scaffolding cognition.
I’m Paul Moss. Follow me on Twitter (@edmerger) or on LinkedIn for more discussions about learning design.
Cover image: Credit: © Images.com/Corbis
